p0f ~辨識系統工具
其實ping 的TTL 數字 是代表不同做系統
例如: window 是128, Linux是64, CISCO設備常常大於255
但這樣使用 已經很少....因為 不是很準確,也有許多軟體取代更精準
所以參考使用
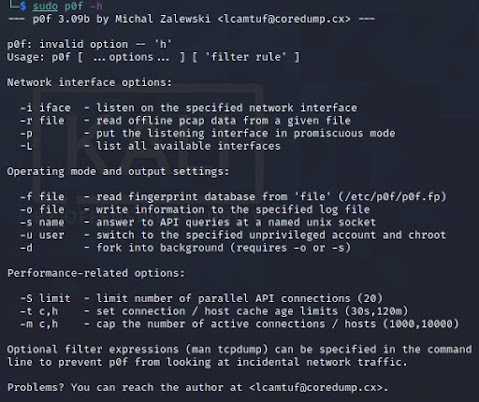
指令說明:
root@kali-linux2:~# p0f -h
--- p0f 3.07b by Michal Zalewski <lcamtuf@coredump.cx> ---
./p0f: invalid option -- 'h'
Usage: p0f [ ...options... ] [ 'filter rule' ]
Network interface options:
-i iface - listen on the specified network interface
-r file - read offline pcap data from a given file
-p - put the listening interface in promiscuous mode
-L - list all available interfaces
Operating mode and output settings:
-f file - read fingerprint database from 'file' (p0f.fp)
-o file - write information to the specified log file
-s name - answer to API queries at a named unix socket
-u user - switch to the specified unprivileged account and chroot
-d - fork into background (requires -o or -s)
Performance-related options:
-S limit - limit number of parallel API connections (20)
-t c,h - set connection / host cache age limits (30s,120m)
-m c,h - cap the number of active connections / hosts (1000,10000)
Optional filter expressions (man tcpdump) can be specified in the command
line to prevent p0f from looking at incidental network traffic.
Problems? You can reach the author at <lcamtuf@coredump.cx>.
例如: p0f -p


留言
張貼留言